はじめに
Virtual Earth Map Controlは、
コレクションの表示
Live Search Mapsにはプッシュピンのグループや経路情報を作成して管理できるコレクションという機能があります
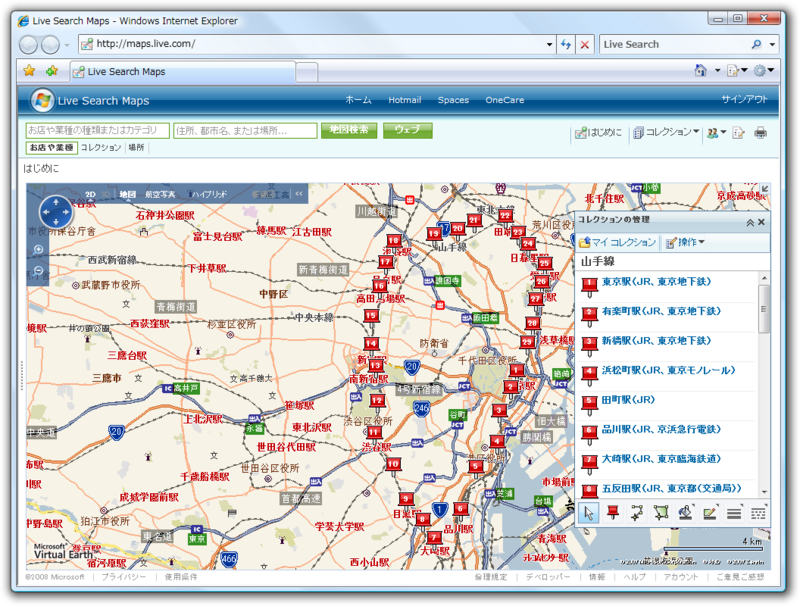
まずは単純にマップを表示するだけのページを作成します。本連載の第4回目も参考にしてください
<!DOCTYPE html PUBLIC "-//W3C//DTD XHTML 1.0 Transitional//EN" "http://www.w3.org/TR/xhtml1/DTD/xhtml1-transitional.dtd">
<html xmlns="http://www.w3.org/1999/xhtml">
<head>
<meta http-equiv="Content-Type" content="text/html; charset=utf-8" />
<title></title>
<script type="text/javascript" src="http://dev.virtualearth.net/mapcontrol/mapcontrol.ashx?v=6.1&mkt=ja-jp"></script>
<script type="text/javascript">
var map = null;
function pageLoaded() {
map = new VEMap("myMap");
map.LoadMap();
}
</script>
</head>
<body onload="pageLoaded();">
<div id='myMap' style="position:absolute; width:400px; height:400px;"></div>
</body>
</html>コレクションのインポートはVEMapクラスのImportShapeLayerDataメソッドを使用します。
VEMap.ImportShapeLayerData(shapeSource, callback, setBestView);戻り値はありません。ImportShapeLayerDataの引数には次のものを渡します。
| パラメータ | 説明 |
|---|---|
| shapeSource | VEShapeSourceSpecificationオブジェクト。 |
| callback | データのインポート後に呼ばれるコールバック関数。VEShapeLayerオブジェクトが渡されます。 |
| setBestView | trueまたはfalseのブール値。trueの場合、 |
VEShapeSourceSpecificationというクラスが出てきました。このクラスはインポートするデータの形式・
| パラメータ | 説明 |
|---|---|
| dataType | VEDataType列挙体。GeoRSS、 |
| dataSource | GeoRSS、 |
| layer | VEShapeとしてデータをインポートする先のVEShapeLayerオブジェクト。 |
以上をまとめるとコレクションを表示するコードは次のようになります。先ほどのコードのpageLoaded関数の変更と新たにonFeedLoaded関数を追加しています。
function pageLoaded() {
    map = new VEMap("myMap");
    map.LoadMap();

    var layer = new VEShapeLayer();
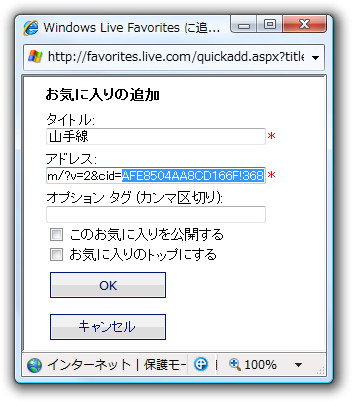
    var spec = new VEShapeSourceSpecification(VEDataType.VECollection, 'AFE8504AA8CD166F!368', layer);
    map.ImportShapeLayerData(spec, onFeedLoaded, true);
}

function onFeedLoaded(layer) {
    alert(layer.GetShapeCount() + ' 個のアイテムをインポートしました。');
}
pageLoaded関数の中では、
コレクションの場合、
変更したコードをWebブラウザで表示すると図1のようになったと思います。プッシュピン上に数字は描かれませんが、
GeoRSS
GeoRSSとはRSSフィードに位置情報を含めた簡単なデータ形式です。RSSという名前が付いていますがAtomフィードにも情報を含めることができます。最もシンプルなGeoRSS-Simpleと呼ばれる形式で1点の位置情報を表す場合は以下のタグをRSS1.
<georss:point>43.062089 141.354507</georss:point>また、
xmlns:georss="http://www.georss.org/georss"Virtual Earth Map Controlは、
WCF配信サービス
配信サービスの作成にはVisual Studio 2008を使用します。Visual Studio 2008にはWCFの配信サービスライブラリのテンプレートが用意されており、
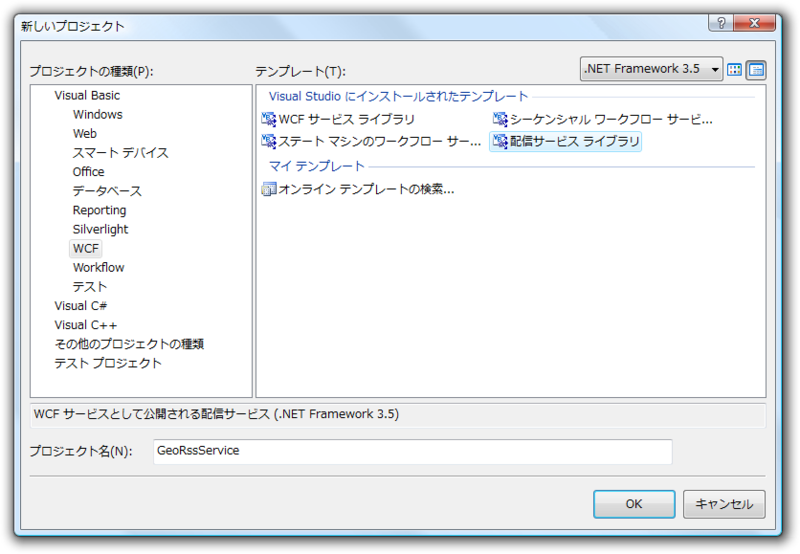
プロジェクトを作成した時点で、
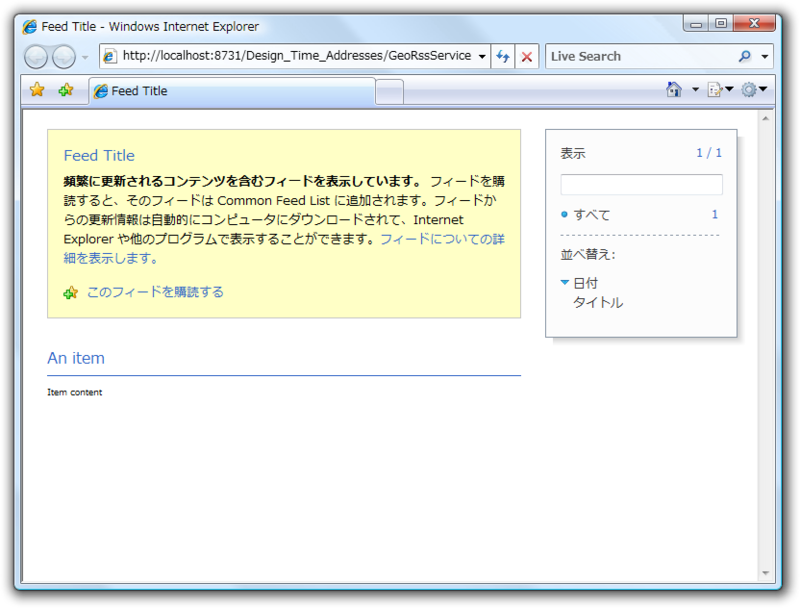
作成されたプロジェクトにはWCFサービスのみ含まれています。そのためサービスを利用するためにはサービスをホストする必要があります。実行時にサービスが確認できたのはWCFサービスホスト
プロジェクトにあるIFeed1.
GeoRSSサービスの作成
作成するGeoRSSのサービス内容を考えます。livedoor天気情報では天気予報用に拡張されたRSSフィードが提供されています。このフィードに経緯度の情報を付加したものはどうでしょうか。
<item>
        <title>[ 今日の天気 ] 札幌 - 晴れ - 最高気温14℃ - 4月6日(日)</title>
        <ldWeather:lwws id="4" />
        <link>http://weather.livedoor.com/area/1b/4.html?r=rss</link>
        <date>Sun, 06 Apr 2008 00:00:00 +0900</date>
        <category type="forecast">天気予報</category>
        <day>Sunday</day>
        <telop>晴れ</telop>
        <image>
                <title>晴れ - livedoor 天気情報</title>
                <link>http://weather.livedoor.com/area/1b/4.html?r=rss</link>
                <url>http://image.weather.livedoor.com/img/icon/1.gif</url>
                <width>50</width>
                <height>31</height>
        </image>
        <description>06日(日)の天気は晴れ、最高気温は14℃ 最低気温は2℃でしょう。</description>
        <source url="http://weather.livedoor.com/forecast/rss/1b/4.xml" />
        <pubDate>Sun, 06 Apr 2008 11:00:00 +0900</pubDate>
</item>
まず、
Imports <xmlns:ldWeather="http://weather.livedoor.com/ns/rss/2.0">ここからはCreateFeedメソッドの内容を変更していきます。最初にメソッドの内容を一度すべて削除してから取り掛かります。フィードを抽象的に表すSyndicationFeedオブジェクトを作成し、
提供されているフィードには地域を表すIDが付いています
Dim latlongs = New Dictionary(Of String, String)
latlongs.Add("4", "43.062089 141.354507")   ' 札幌
latlongs.Add("11", "42.984906 144.381688")  ' 釧路
latlongs.Add("20", "39.72158 140.115595")   ' 秋田
latlongs.Add("25", "38.269993 140.874038")  ' 仙台
latlongs.Add("50", "37.910211 139.05241")   ' 新潟
latlongs.Add("63", "35.68693 139.701805")   ' 東京
latlongs.Add("72", "36.65225 138.180861")   ' 長野
latlongs.Add("38", "35.180508 136.913896")  ' 名古屋
latlongs.Add("81", "34.695755 135.530262")  ' 大阪
latlongs.Add("107", "33.560315 133.535428") ' 高知
latlongs.Add("90", "34.397225 132.461579")  ' 広島
latlongs.Add("110", "33.607543 130.429516") ' 福岡
latlongs.Add("132", "31.52997 130.604439")  ' 鹿児島
latlongs.Add("136", "26.212319 127.685938") ' 那覇
次にRSSフィードのURLからXMLドキュメントの作成とSyndicationFeedオブジェクトを生成します。フィードに含まれる各項目を表すSyndicationItemオブジェクトを格納するコレクションも作成します。
Dim doc = XDocument.Load("http://weather.livedoor.com/forecast/rss/index.xml")
Dim feed = New SyndicationFeed("Weather GeoRSS", "", Nothing)
Dim items = New List(Of SyndicationItem)XMLドキュメントから各<item>要素を取得します。<category>要素の値が”
For Each e In doc...<item>
    If e.<category>.Value = "PR" Then
        Continue For
    End If
    ' ここにSyndicationItemオブジェクト作成する処理を記述
Next
SyndicationItemクラスのコンストラクタには、
Dim item = New SyndicationItem(e.<title>.Value, _
                               e.<description>.Value & e.<image>.<url>.Value, _
                               New Uri(e.<link>.Value))
item.PublishDate = New DateTimeOffset(DateTime.Parse(e.<pubDate>.Value))
<georss:point>のようにSyndicationItemの要素として用意されてないものを追加する場合は、
Dim id = e.<ldWeather:lwws>.@id
Dim point = <georss:point xmlns:georss="http://www.georss.org/georss">
                <%= latlongs(id) %></georss:point>
item.ElementExtensions.Add(point)

items.Add(item) ' コレクションへ追加
最後にURLのパラメータに応じてAtomまたはRSS用のSyndicationFeedFormatterオブジェクトを返します。
Dim query As String = WebOperationContext.Current.IncomingRequest.UriTemplateMatch.QueryParameters.Get("format")
If (query = "atom") Then
    Return New Atom10FeedFormatter(feed)
Else
    Return New Rss20FeedFormatter(feed)
End If
以上でGeoRSSサービスの完成です。実行してフィードが表示されたでしょうか? 上記のコードをまとめたものは以下のファイル
GeoRSSの表示
作成したサービスをVirtual Earth Map Controlからインポートしましょう。ここで注意点ですが、
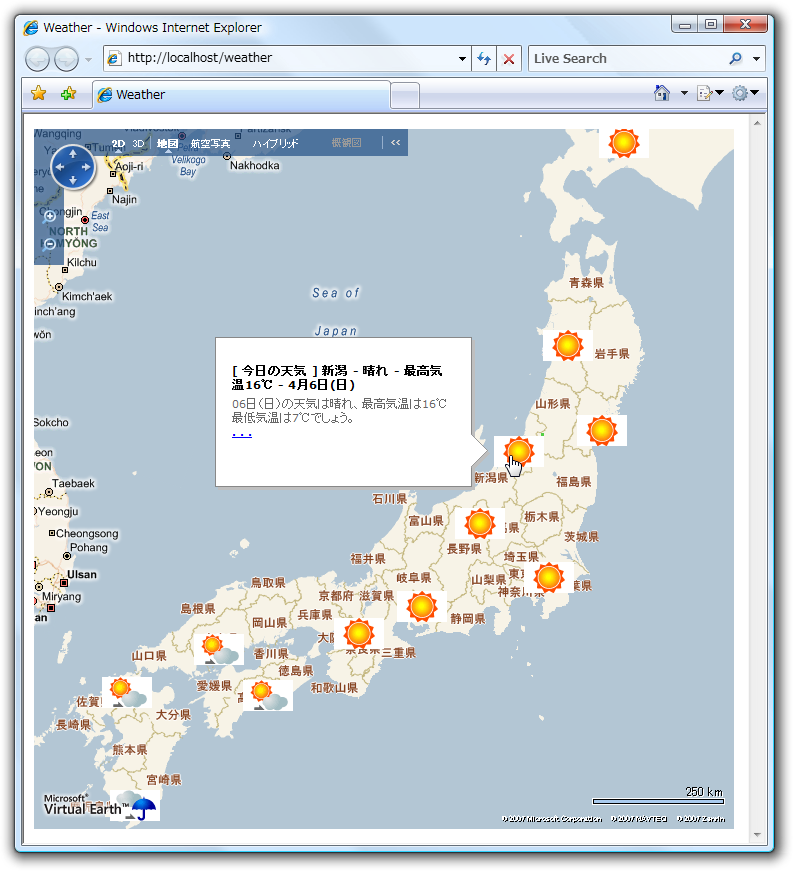
環境さえできれば後は簡単です。コレクションの表示のときに使用したコードを変更します。VEShapeSourceSpecificationオブジェクトの生成時にVEDataType.
function pageLoaded() {
    map = new VEMap("myMap");
    map.LoadMap();

    var layer = new VEShapeLayer();
    var spec = new VEShapeSourceSpecification(VEDataType.GeoRSS, 'http://localhost/weather/georss/', layer);
    map.ImportShapeLayerData(spec, onFeedLoaded, true);
}
onFeedLoaded関数の中でプッシュピンの画像の代わりに、
function onFeedLoaded(layer) {
    for (var i = 0; i < layer.GetShapeCount(); ++i) {
        var s = layer.GetShapeByIndex(i);
        var desc = s.GetDescription();
        var url = desc.match(/http:\/\/.*/); // 説明に含まれているURLを取得
        s.SetDescription(desc.replace(url, ''));
        s.SetCustomIcon('<img src="' + url + '" />');
    }
}実行した結果は図5のようになります。うまくできたでしょうか? 以上で今回の内容は終了です。GeoRSSと同様にKMLと呼ばれるXML形式のデータもインポートができます。そちらについても是非試してみてください。
