皆さま、明けましておめでとうございます。今年もよろしくお願いします。
さて、年明けにふさわしく、筆者らが所属するHapyrusは2014年の年始にFlyData Inc. と名前を変えました。今年もAmazon Redshiftをはじめとしたビッグデータ・クラウドインテグレーションを推進していきます。ちなみに、gihyo.jpにもその発表会の様子が掲載されています。
埋もれるデータをクラウドに飛ばせ! HapyrusあらためFlyData Inc.が日本でも本格始動
さて、前回からもたくさんの Amazon Redshiftに関する興味深いアップデートが発表されています。それらをご紹介し、より便利になった詳細について見て行きましょう。
データベース監査ログ
Amazon Redshiftはデータベース内のアクティビティをロギングする仕組みをサポートしました。この機能によって、セキュリティ監査とトラブルシューティング両方のモニタリングが可能になります。このログはAmazon S3バケットに格納され、モニタリングする必要があるユーザはそのログデータにアクセスすることで監査を行うことができます。
この新リリースによって、アクティビティログを保存することに加え、接続ログやユーザに関するログも確保できます(AWSはこれを「データベースユーザ定義に対する変更の情報」と呼んでいます) 。
監査ログ保存を開始するには、まず監査ログ機能をAWSコンソール、Amazon RedshiftのAPI、またはAWSコマンドラインインターフェース(CLI)によって有効にします。その後、ユーザアクティビティログを有効にするには、enable_user_activity_loggingというRedshiftパラメータを有効にする必要があります。この記事ではAWSコンソールによってこの機能を有効化していますが、基本的には上記の3つの方法は全て同じものです。
では、その設定方法を見て行きましょう。まず、AWSコンソールの既存のRedshiftクラスタ画面に行きます。クラスタ名をクリックすると、「 Configure Audit Logging」というドロップダウンメニューを選びます。
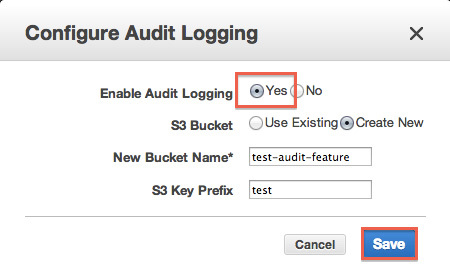
図1 AWSコンソールのRedshiftクラスタ名から「Configure Audit Logging」を選択 図2 「 Enable Audit Logging」をチェックして「Save」で保存、監査ログ機能を有効に 監査ログ設定をした後は、クラスタ詳細が以下のように変更されます。
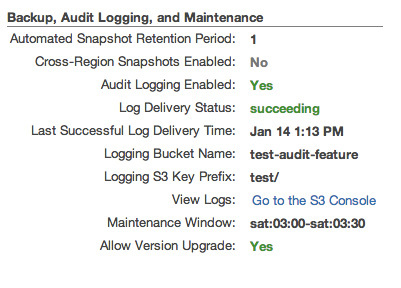
図3 監査ログ機能有効化後のクラスタの詳細しばらくすると、ログが指定したS3バケットに保存され始めます。また、ステータスも以下のように変更されているのが確認できるでしょう。
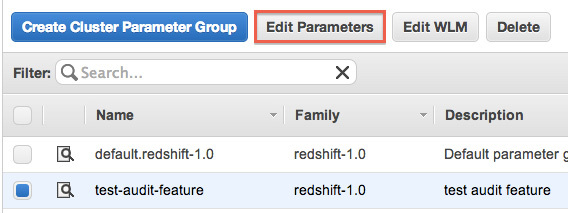
図4 監査ログの収集が開始されステータスが変わる次に、ユーザアクティビティログを有効化するために、Cluster Parameter Groupを作成し、そのパラメータグループをクラスタに紐付けます。パラメータグループを編集したい場合は、「 Edit Parameters」をクリックします。
図5 Cluster Parameter Groupの編集メニュー編集ページでは、enable_user_activity_loggingにtrueをセットし、 Save をクリックします。
これで ユーザアクティビティロギングを有効にするCluster Parameter Groupが作成されました。このパラメータグループをクラスタに紐付けることで、変更を有効にすることができます。それには、クラスタ詳細ページに戻り、「 Cluster > Modify」をクリックします。
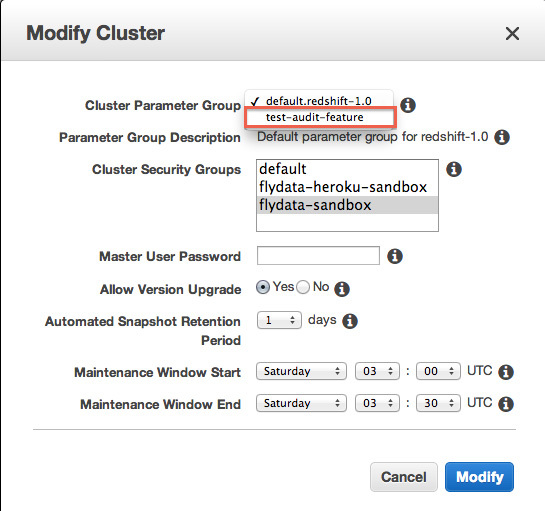
図6 クラスタ詳細ページでCluster > Modifyを選ぶ最後に、「 Modify Cluster」画面にて、作成したクラスタパラメータグループを選択します。
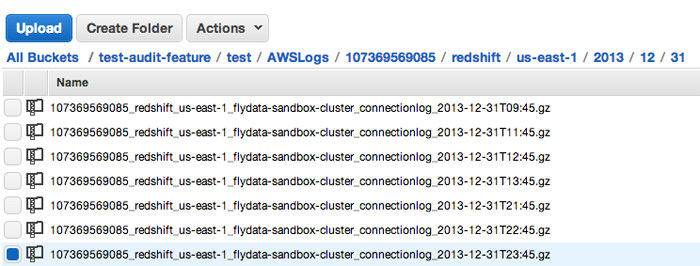
図7 Modify Cluster画面これで完了です!指定したS3バケットにユーザアクティビティログが出力されているか確認してみましょう。
図8 ユーザアクティビティログの一覧これが実際のログ内容の例です。
図9 ログの表示例参照リンク
VPC内でのクラスタ管理機能向上
AWSは、バーチャルプライベートクラウド(VPC)内にあるRedshiftクラスタに対してelastic IPアドレスを使いパブリックアクセスできる方法をドキュメントに追加しました。Redshiftクラスタにアクセスするためにpublic IPアドレスを設定することで、VPCの外からもより柔軟にクラスタにアクセスすることができるようになります。詳細は以下のリンクをご覧ください。
Amazon RedshiftのためのCloudTrailログ
先日のre:Inventイベントで発表されたCloudTrailログもRedshiftで利用可能になっています。詳細は以下のリンクをご参照ください。
TIPS:Redshiftの実使用量をSQLでモニタする方法
皆さんご存知のように、Amazon Redshiftは最小インスタンスでも圧縮状態で2TBまでのデータを格納できる容量がありますので、あまりデータが多くない環境であればデータベース容量は気にならないかもしれません。しかし、転送データ量が多かったり本番環境で運用している場合は、実使用容量をモニタリングする必要があるでしょう。Redshiftでは、そのための方法が以下のようにいくつか提供されています。
Web (AWSのコンソール) からの確認
Amazon CloudWatchのアラームの利用
SQLで確認し、独自にモニタリング
ここでは、一番汎用性があるSQLでの確認方法をご紹介します。
テーブルごとのデータサイズを確認するには、以下のSQLを利用します(このSQLを実行するにはスーパーユーザ権限が必要です) 。
select
    trim (pgdb.datname) as Database,
    trim (pgn.nspname) as Schema,
    trim (a.name) as Table,
    b.mbytes,
    a.rows
from
    (
        select
            db_id,
            id,
            name,
            sum (rows) as rows
        from
            stv_tbl_perm a
        group by
            db_id,
            id,
            name
    ) as a join
    pg_class as pgc
on  pgc.oid = a.id join
    pg_namespace as pgn
on  pgn.oid = pgc.relnamespace join
    pg_database as pgdb
on  pgdb.oid = a.db_id join
    (
        select
            tbl,
            count(*) as mbytes
        from
            stv_blocklist
        group by
            tbl
    ) b
on  a.id = b.tbl
order by
    mbytes desc,
    a.db_id,
    a.name
;
また、以下のSQLでクラスタ全体の空き容量を知ることができます。
select
    sum (capacity) / 1024 as capacity_gbytes,
    sum (used) / 1024 as used_gbytes,
    (sum (capacity) - sum (used)) / 1024 as free_gbytes
from
    stv_partitions
where
    part_begin = 0
;
実際にpsql等を利用して実行してみてください。これをZabbixやNagiosなどのモニタリングツールと組み合わせることで、柔軟な容量監視が可能になるはずです。
なお、詳細はAWS発表の以下の資料(英語)をご覧ください。
最後に
Amazon Redshiftは2013年2月15日に一般公開されてから来月(2月)で丸1年が経ちます。これまでも矢継ぎ早に新機能をリリースしてきたRedshift開発チームのことなので、何かしらその時期にあわせた発表があるかもしれませんね。期待しましょう!
筆者が所属するFlyData では、Amazon Redshiftを使いはじめるためのリアルタイム継続データインテグレーションサービスFlyData for Amazon Redshift を提供しています。最近、RDBMS(MySQL)とRedshiftの連携機能であるFlyData Syncもリリースしました。また、Amazon Redshiftの導入コンサルティングも行っていますので、興味がある方はぜひお気軽に info@flydata.com にお問い合わせください。

